Jupyter
Angelegt Sonntag 01 November 2026
# Als Jupyter Notebook
```python
import numpy as np
import matplotlib.pyplot as plt

x = np.linspace(0, 2 * np.pi, 200)
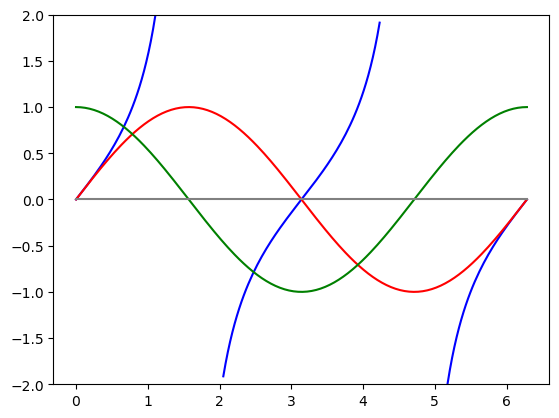
y = np.tan(x)

masked_y = np.ma.masked_where(np.abs(y) > 2, y)
plt.plot(x, masked_y, color='blue')
plt.ylim(-2, 2) # Optional: Y-Achse anpassen für bessere Darstellung
plt.plot(x, np.sin(x), color='red')
plt.plot(x, np.cos(x), color='green')
plt.plot(x, x-x, color='grey')
plt.show()
```